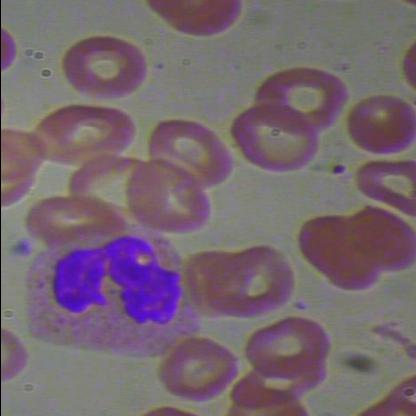
YOLO26n · RBC / WBC / platelets
DETECT.CLASSIFY.COUNT.
Computer-aided hematology from a single smear. Localize, name, and quantify cells in one field of view.
001 — THE EYE SAVER
Counting 500 cells by hand
is a great way to lose your sanity.
We taught YOLO to do the staring,
so clinicians don't have to.
85.4% mAP@50 · 36 held-out fields · research prototype
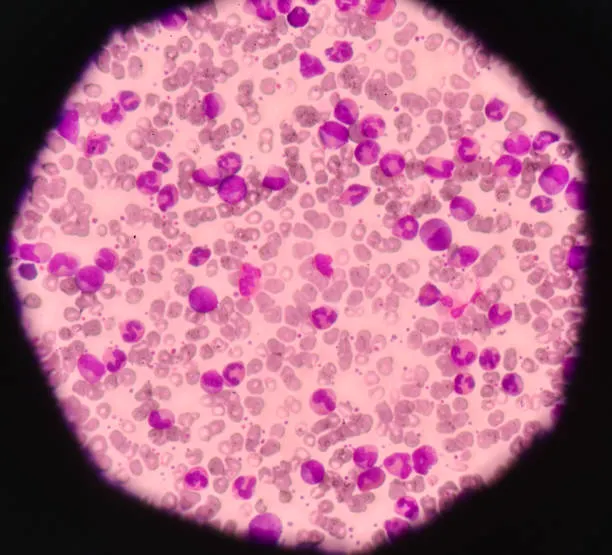
Wright–Giemsa · 100x
01 · Detect
Localize every cell in the field.
02 · Classify
RBC, WBC, or platelet at live gates.
03 · Count
Per-class totals for this field of view.
002 — THE SPECIMEN
Place thespecimen.
003 — THE HELD-OUT FIELD
The curve,then the gate.
Detector quality is measured as COCO mAP on 36 held-out fields (471 instances). The lab does not count on that curve. It infers at 0.40, then keeps RBC ≥ 0.60, WBC ≥ 0.40, platelets ≥ 0.40.
mAP@50
85.4%
baseline 81.81%
mAP@50-95
60.07%
baseline 56.47%
Precision
82.46%
baseline 71.74%
+3.6 mAP@50 vs our own baseline after label correction
Per-class mAP@50
WBC
96.9%
baseline 96.9%
RBC
85.4%
baseline 83.4%
Platelets
73.9%
baseline 65.1%
COCO mAP at conf=0.001. Counting in the lab uses live class gates, not this curve. Platelets remain the hard class. Research prototype · not a diagnostic device.